1 min read
Data in Acumatica: How Built-In Tools Allow for Greater Visibility
Your data is only as good as the tools you use to analyze it. What is the point of investing in a modern cloud-based ERP system if you can’t make...
2 min read
A modern ERP solution – one built in the cloud, not simply retrofitted for it – will have all the latest bells and whistles and solve everyday problems in the most efficient way possible. Acumatica does exactly that with all of its reporting tools.
We’ve covered the basics before, but this blog will take a deeper dive into one of the first features a user will notice upon logging into the system: dashboards. A user can set their home screen to look EXACTLY how they need it to look, providing quick links to daily tasks, an overview of any relevant data, a task report, or a to-do list. Really: the possibilities are endless. Whatever you or your team needs, it’s likely that Acumatica can make it into a dashboard item (if you need help with this, ask a Milestone expert!)
Any dashboard within Acumatica can be assigned to any number of users, and users can have access to multiple dashboards. You can set up dashboards based upon the company's custom configurations, but Acumatica comes pre-built with several dashboards out-of-the-box if you need a starting point. Out-of-the-box dashboards include popular role-based configurations like management, AP clerk, or controller.
To see a short video of Acumatica Dashboards in action, check it out here:
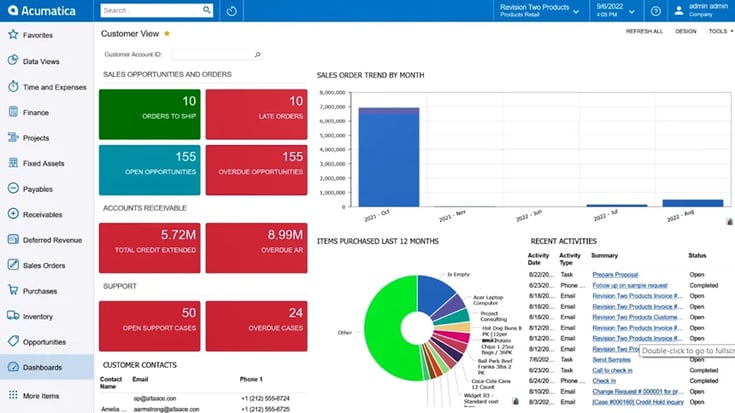
One pre-built Acumatica Dashboard is a Customer View. Each of the widgets on the dashboard is actually a SQL-driven inquiry that a user has written in the background and then created a tile, a chart, or just a data table that allows us to view information.
This Customer View gives a look at different opportunities and orders, accounts receivable and sales order trends, as well as allowing drilldown into a specific customer to view. Then you can view that same data as it relates to that particular record.
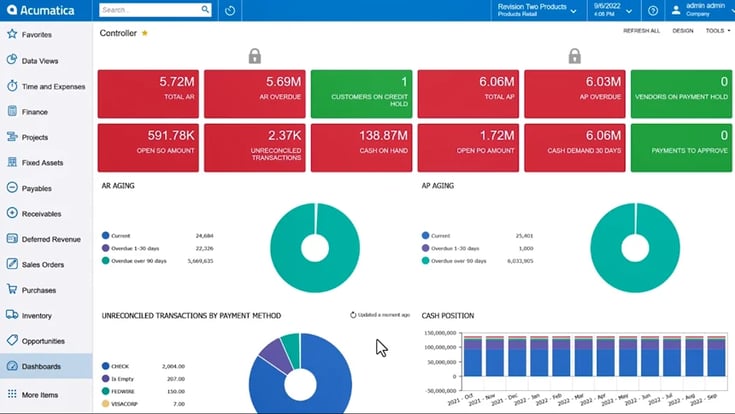
Another out-of-the-box dashboard is a Controller Dashboard, which provides financial data such as total accounts receivable on reconcile transactions, open purchase order amounts, as well as total A/P. It also gives you a quick look at your aging cash position and current period expenses.
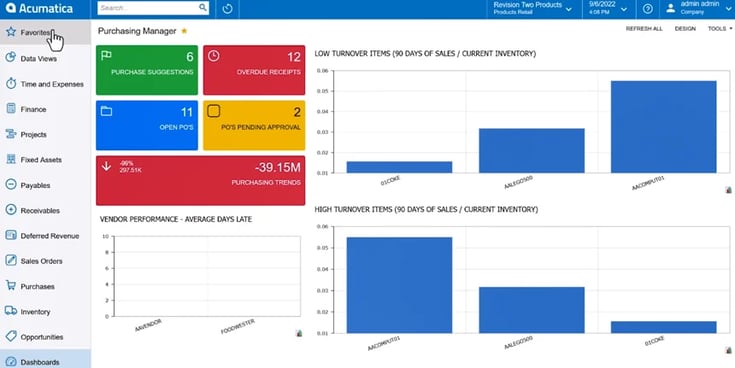
Purchasing Manager is yet another out-of-the-box option. This dashboard gives you some various tiles on purchase suggestions, purchase orders that are pending approval, and open POs. It's also displaying some information on purchasing trends, as well as items that have low turnover.
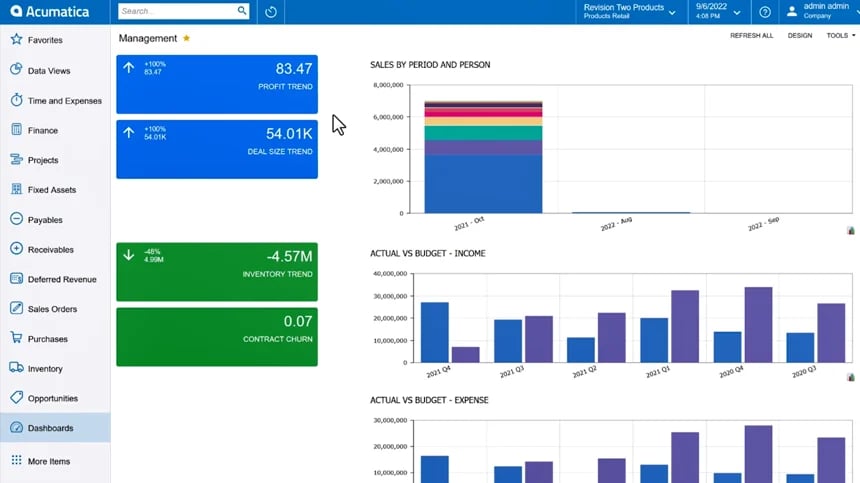
One final dashboard to explore is the Management Dashboard. This dashboard is designed to give the upper level management and C-suite all the information they require regarding trends such as profits, deal size, and inventory. It also provides a quick look at some financials for our income and expenses actual versus budgeted.
All of the above pre-made dashboards in Acumatica can, of course, be customized for any company, team, or user’s unique needs. For an example of how to add a widget to a dashboard, we'll use the controller dashboard.
We simply click “Design” in the top right corner, and then click “Add a New Widget.”
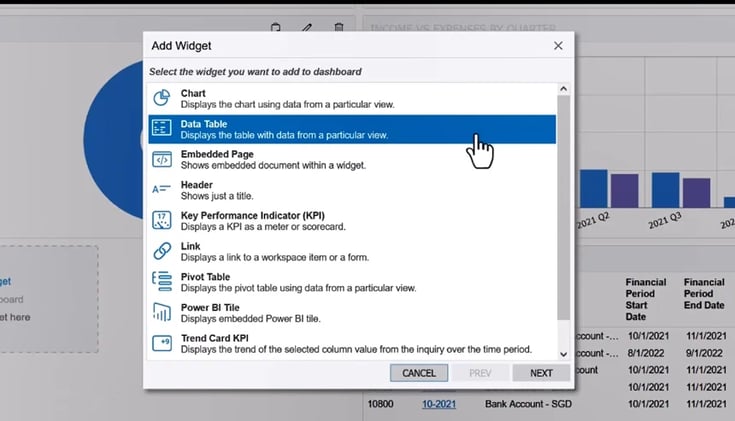 Now you can see the various widgets that are available to you, including tables and charts, KPIs, or even a Power BI tile (if your team is utilizing the integrated Power BI solution).
For this purpose, we will select data table and click “Next.”
Now, search through the inquiries that exist in Acumatica. Select whichever you want to see (e.g. “Cash by Period).
Then create any filters you’d like to apply to the specific dashboard widget.
Here you can also tell the system how often you want it to refresh, whether it's on page reload or every few minutes.
Next, give it a caption and click “Finish.”
Just resize it so that all of the data is displayed how you like, and then click off of the design tool.
Now, a “Cash by Period” widget has been added to my specific Controller Dashboard and is easily visible on my home screen.
Acumatica offers between 10 to 12 dashboards right out-of-the-box and then you can adjust them or configure additional from scratch, as required. See how simple life can be? If you’re still having trouble, be sure to contact the Milestone Acumatica team!
1 min read
Your data is only as good as the tools you use to analyze it. What is the point of investing in a modern cloud-based ERP system if you can’t make...
1 min read
Warehouse picking and packing works fine when order volume is manageable. But as operations grow, small errors begin to create larger problems, from...

1 min read
Most companies don't start comparing QuickBooks and Acumatica because QuickBooks stopped working. They start comparing them because the business...