1 min read
Dashboards in Acumatica: Reporting Tools for Modern Workplaces
A modern ERP solution – one built in the cloud, not simply retrofitted for it – will have all the latest bells and whistles and solve everyday...
2 min read
Your data is only as good as the tools you use to analyze it. What is the point of investing in a modern cloud-based ERP system if you can’t make heads or tails of the data you’re collecting? If you can’t even FIND what you’re looking for within the software? The benefit of an end-to-end solution is that you don’t need to compile the pertinent information from disparate sources and translate them into the same language. Acumatica has plenty of native tools to provide exactly the insight you need from your system to make smart business decisions.
[Though, if you’re still having trouble, you can always contact a Milestone specialist and ask all your burning questions!]
This blog will look at the basic functions that Acumatica uses to provide a clear vision of what is happening across all of your business processes, interactive and in real time.
Dashboards are the first method that Acumatica uses to display any essential data you (or your team) need to know – you’ll notice the dashboard immediately upon opening the system.

Dashboards can be customized by individual, role, or department, and designed to display any number of relevant financial, operational, and organizational indicators. Role-based security can be established to ensure that nobody in the company sees what they aren’t supposed to.
These views are built using SQL-driven queries, and can be presented in a graphical inquiry form. You can also utilize videos, wiki articles, and even PowerBI tables to display as widgets on your dashboard. Each of these widgets will allow you to drill down into the data that it represents, using the Acumatica Generic Inquiry tool.
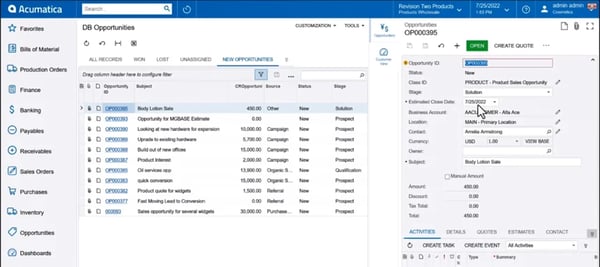
Generic Inquiries (“GIs” for short) allow users to pull data from various tables and present that data in a meaningful way. This can take countless forms: on reports, in dashboards, usable for BI tools, filters, and more. Generic Inquiries are the basic building blocks of data analysis in Acumatica and require no coding knowledge: just select the data you need using Acumatica’s wizards and follow the steps.
This example takes a quick look at opportunities.
In this screen, you can use GIs to highlight any of the fields you’d like based upon various conditions – in this example, Estimated Closed Date. You also can highlight fields that need to be populated with data.
That is a simple example but the possibilities truly are endless.
Acumatica allows users to utilize filters within the system. Once created, you have the option to share the filter view with other users, or just have specific filters for yourself. They are easy to work with – simply click on your filter settings to create a new filter. Select a property, give it a condition, and then save that filter. After you save, you will see that an additional tab has been added and the filter is ready to use.
Watch this video to see how to create a new filter using “Nurture No Activity” as an example.
The side panels in Acumatica are yet another way to get a deeper look into your processes. Side panels present additional detail about your data without having to open up multiple screens or tabs. They can be set up almost anywhere to quickly access related tasks.
1 min read
A modern ERP solution – one built in the cloud, not simply retrofitted for it – will have all the latest bells and whistles and solve everyday...
1 min read
Your production floor is the backbone of your manufacturing business. The accounting or sales department can be a well-oiled machine on its own, but...

1 min read
Most companies don't start comparing QuickBooks and Acumatica because QuickBooks stopped working. They start comparing them because the business...