Acumatica Reporting and Dashboards
Track what matters, share insights, and make better decisions—faster.
From high-level KPIs to day-to-day performance metrics, Acumatica puts the data you need at your fingertips—when and where you need it.
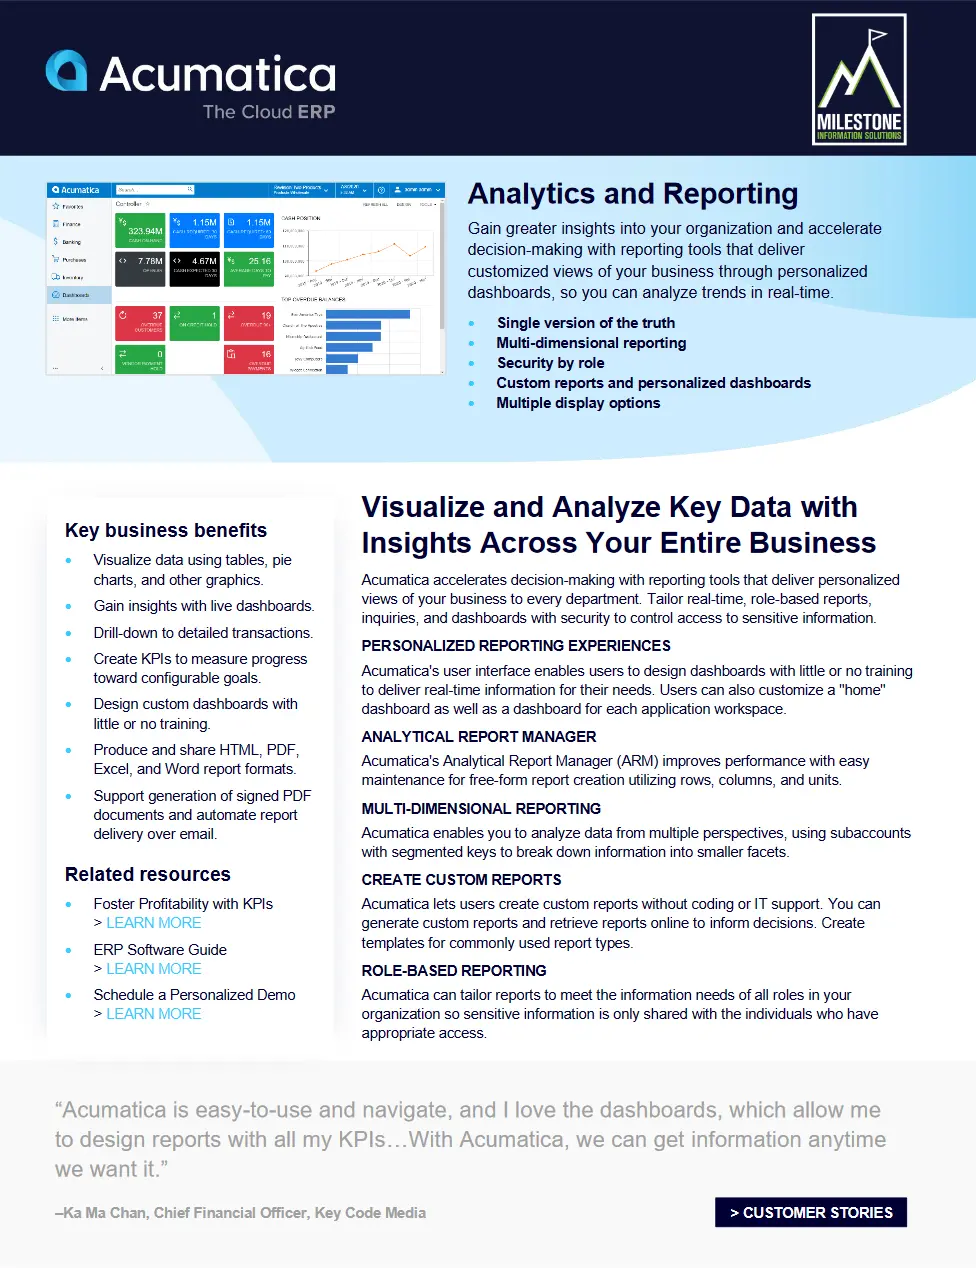
Bring Clarity to your Business with Real-Time Visibility
When teams rely on disconnected spreadsheets or outdated reports, it's hard to see what’s really happening. Acumatica solves that by giving you a centralized, real-time view of your financial and operational performance. Every dashboard, report, and KPI pulls from live system data—so you can trust what you’re seeing and move with confidence.
Tailor Dashboards For Every Team
Give each department exactly what they need to track performance—without exposing sensitive data.
Build Reports Without IT
Create reports using intuitive tools. No coding, no waiting—just answers when you need them.
Stay on Top of KPI's
Monitor the metrics that matter most with live dashboards, goal tracking, and visual alerts.
Drill Down into Details
Start at a high level, then click straight into the transactions behind the numbers.
Automate Report Delivery
Save time by scheduling recurring reports and emailing signed PDFs to your team automatically.
Use Excel and Power BI When You Need To
Export data to Excel or analyze it with Power BI—Acumatica makes it easy to work the way you want.
Give Your Team the Insights to Take Action
Download the datasheet to see how Acumatica Reporting and Dashboards helps you visualize performance, reduce delays, and make faster, better decisions.